Track your company’s performance in My hub under the Analytics tab.
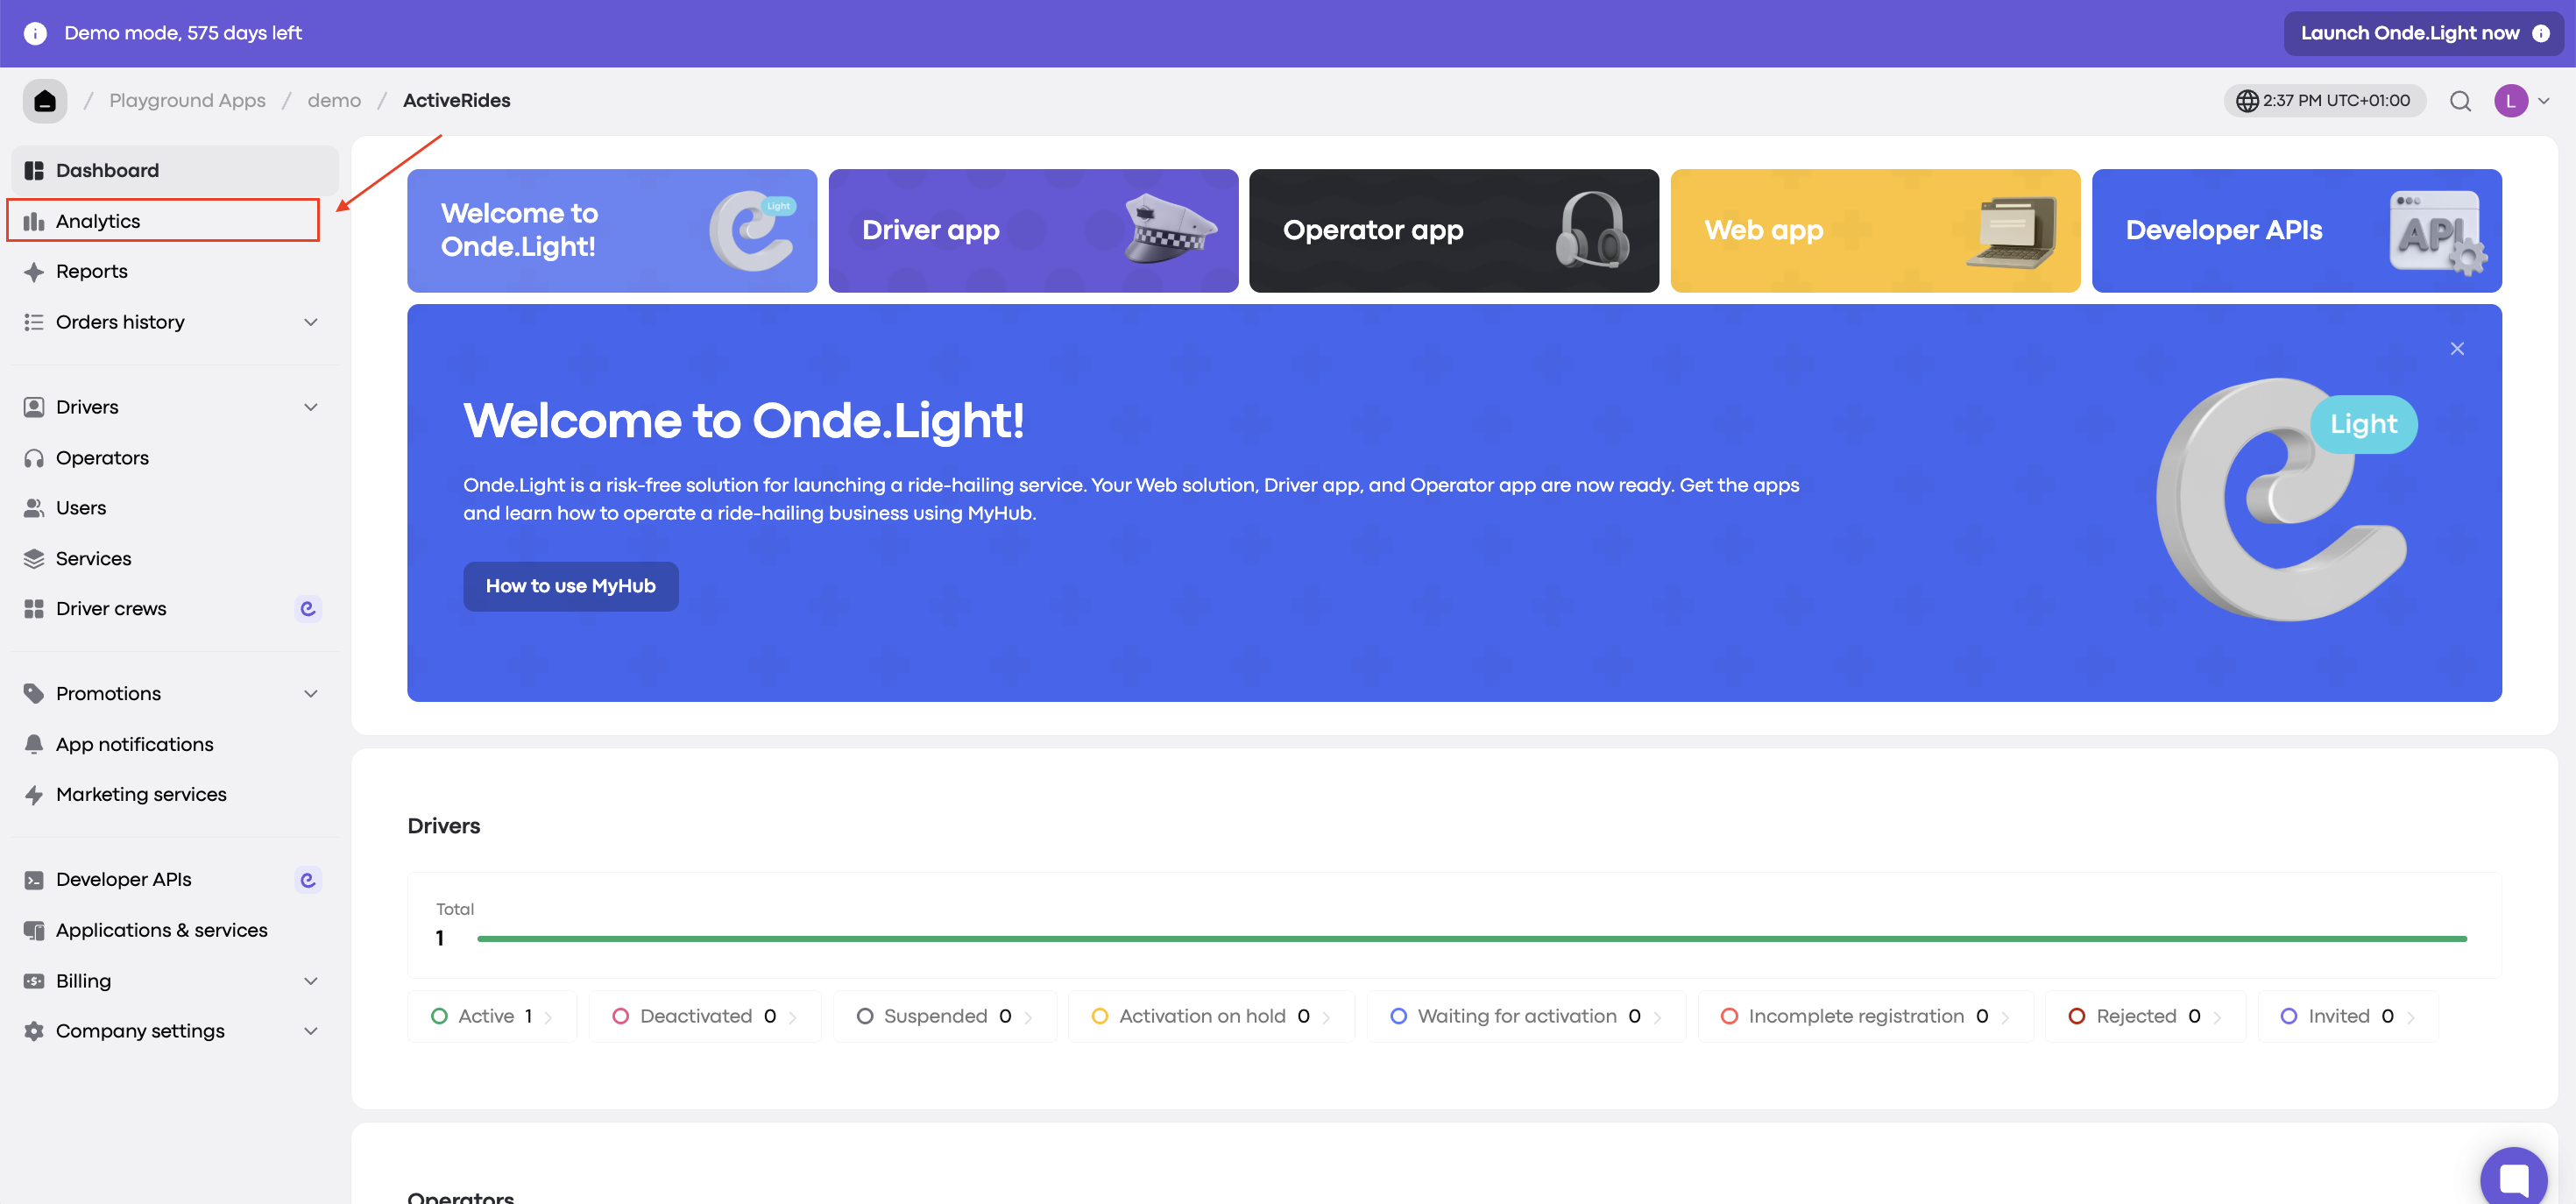
You can view the charts for a selected period (day, month, or year).

Here’s what each chart shows and how to use it.
Shows the ratio of orders accepted by drivers to orders missed.
Assigned orders: jobs accepted by drivers.
Missed orders: jobs that weren’t accepted by any driver within the proposal time.
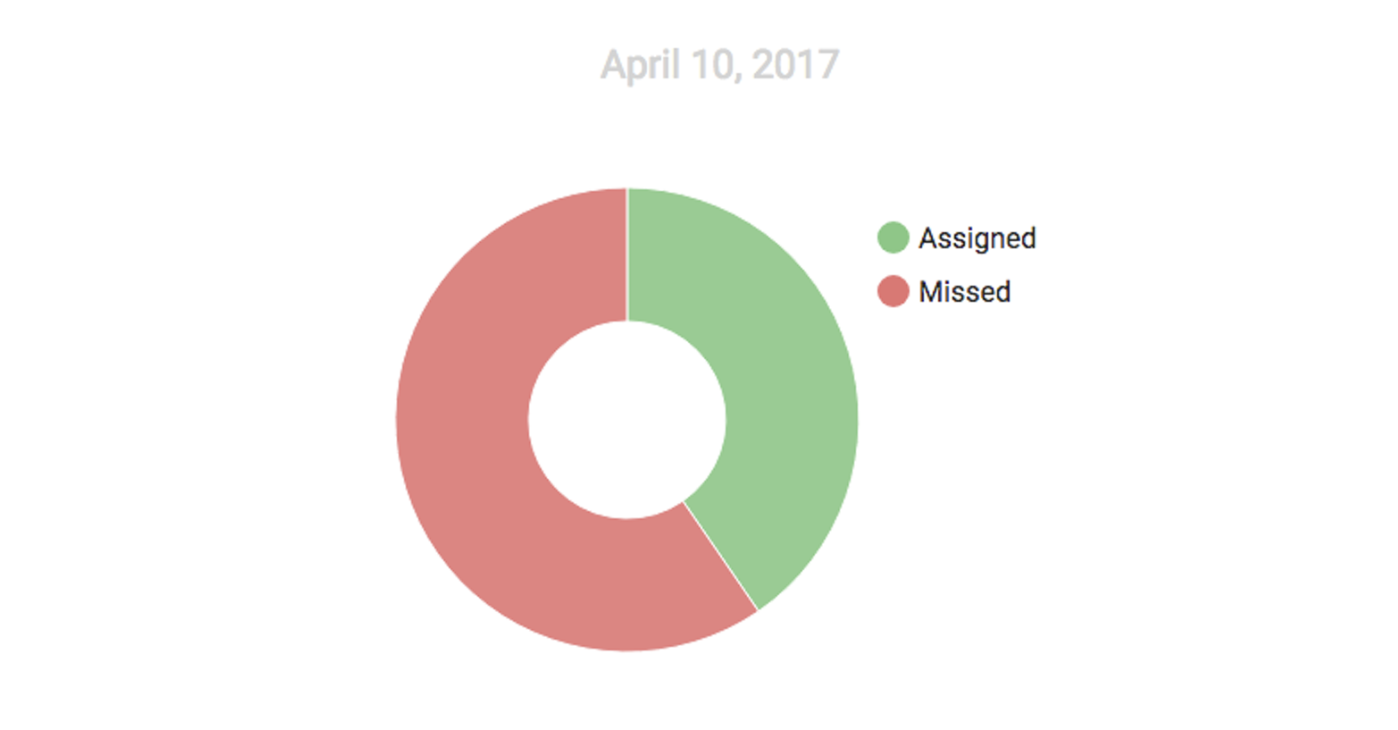
What to look for: Fewer missed orders mean better operational efficiency. A high number may mean it’s time to review your business model.
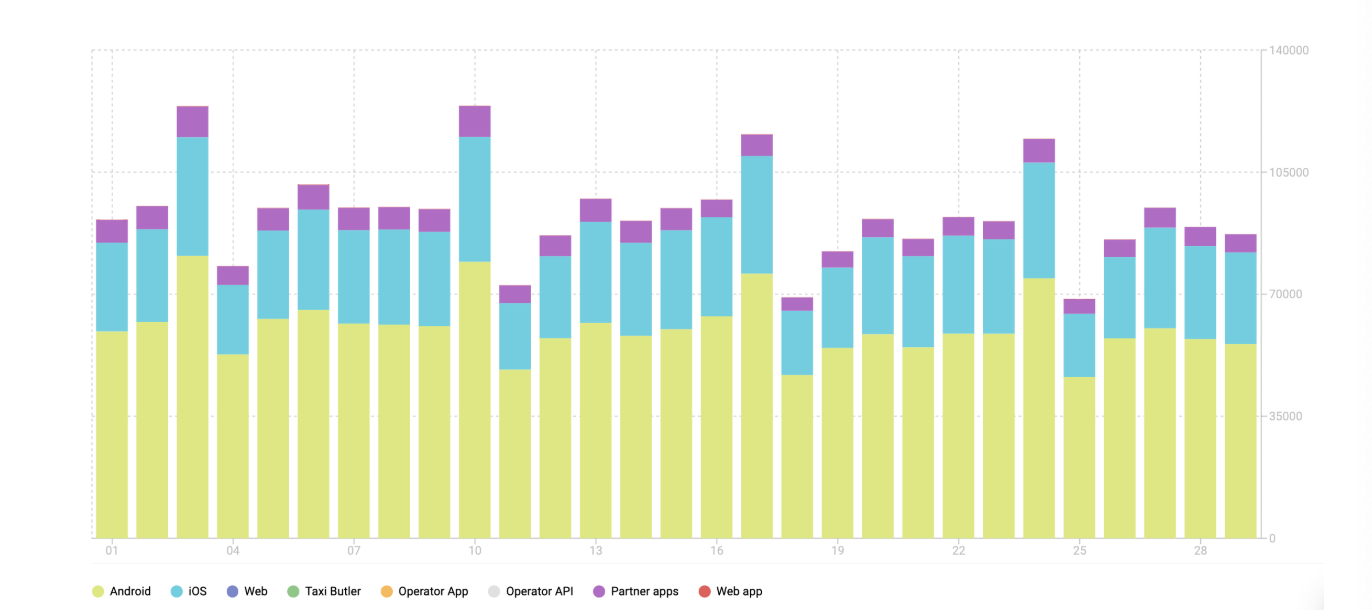
Shows the platforms your orders came from.
What to look for:
Which platforms bring in the most orders.
How effective your partnerships are (if applicable).
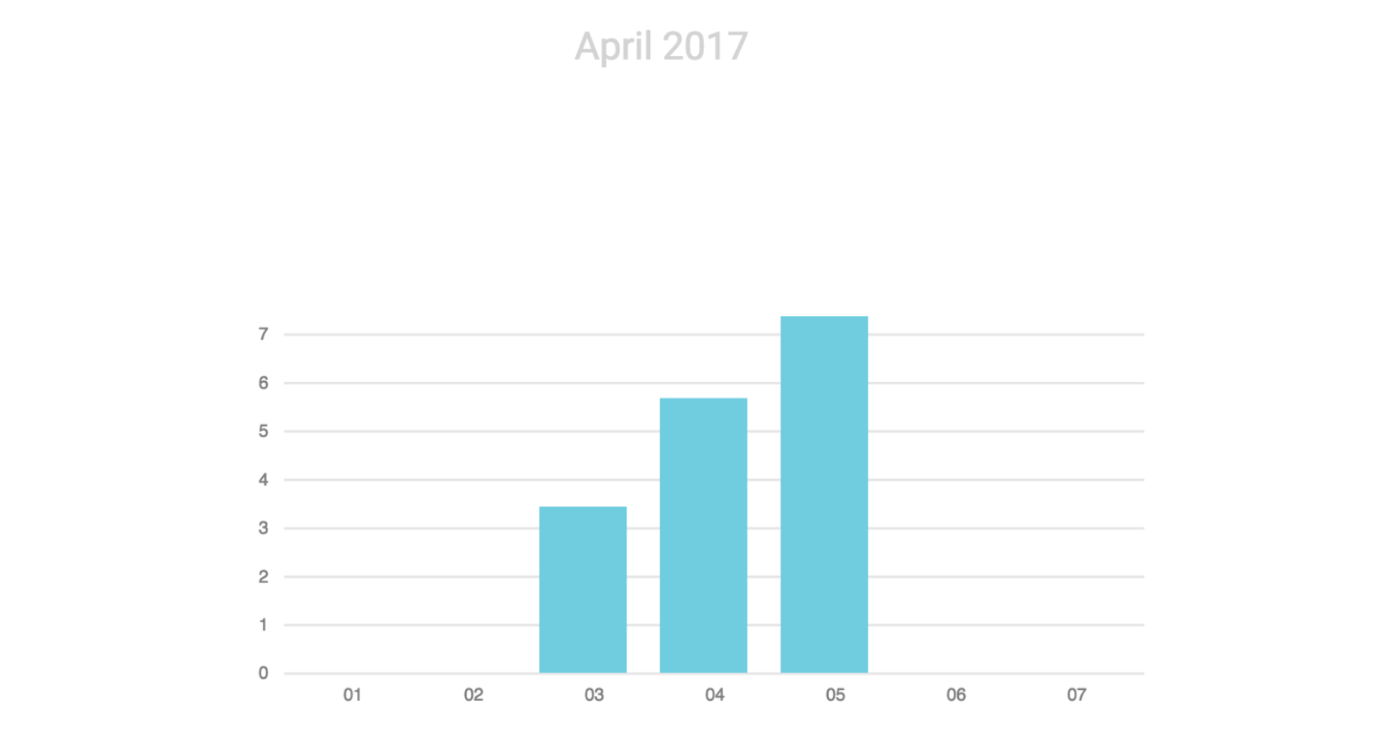
Shows how long drivers take to confirm or bid on a job offer. The median is the middle value when all response times are listed in order.
What to look for:
Faster responses improve your reputation.
Slow responses may point to missed notifications or low driver engagement. Consider ways to motivate your drivers.
A bar chart comparing driver response times with client waiting times and cancellations.
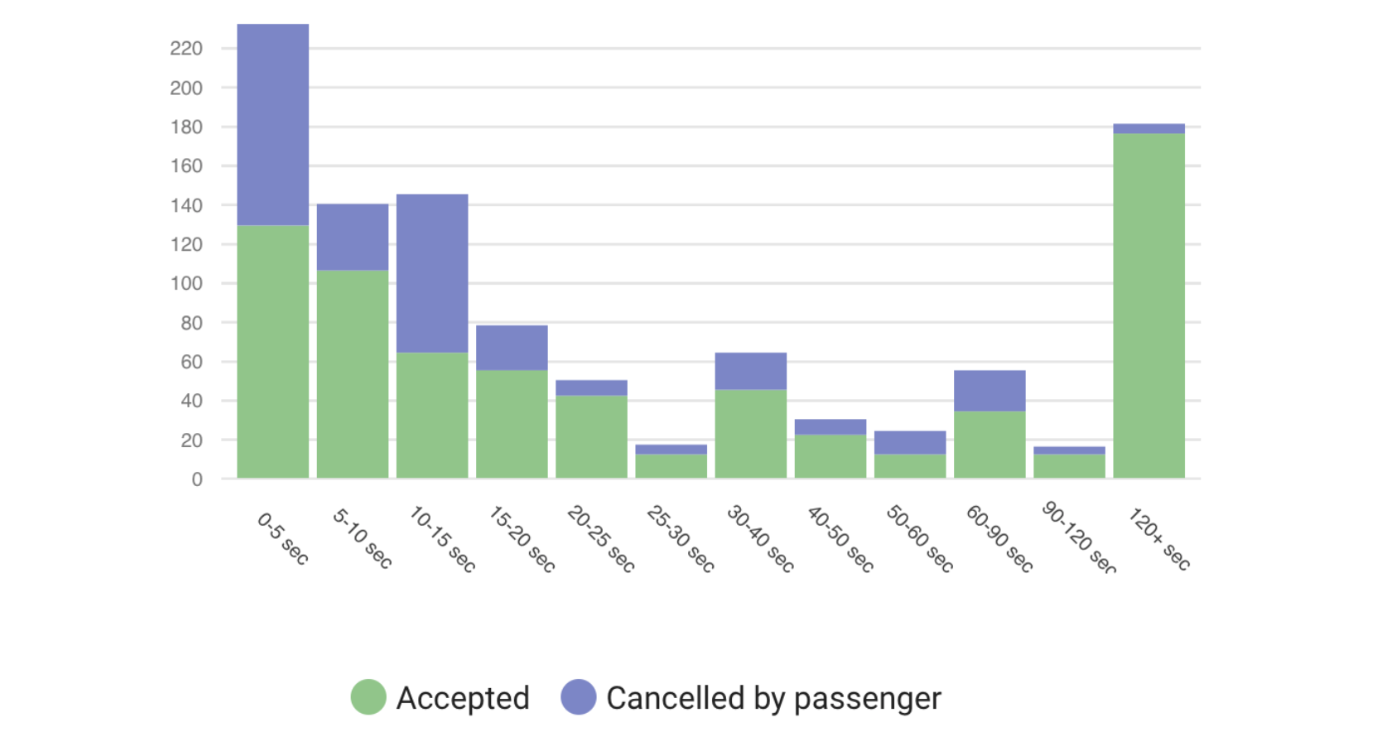
What to look for: This chart helps you find the response time that keeps cancellations low and customers satisfied.
Breaks down all orders by status:
Completed: accepted and completed by drivers (paid and unpaid).
Cancelled by driver: cancelled by the driver, for example because the customer didn’t show up or the trip wasn’t confirmed.
Cancelled by customer: cancelled by the customer after the driver accepted, for example because they changed their mind or the taxi didn’t arrive at the pickup point.
Cancelled by operator: cancelled by an operator after the driver accepted.
Cancelled by system: cancelled by the platform for technical reasons.
What to look for: Trends in cancellations, which can point to specific issues such as driver engagement or fleet size.
Shows total revenue from drivers and customers, including driver top-ups and manual account top-ups.
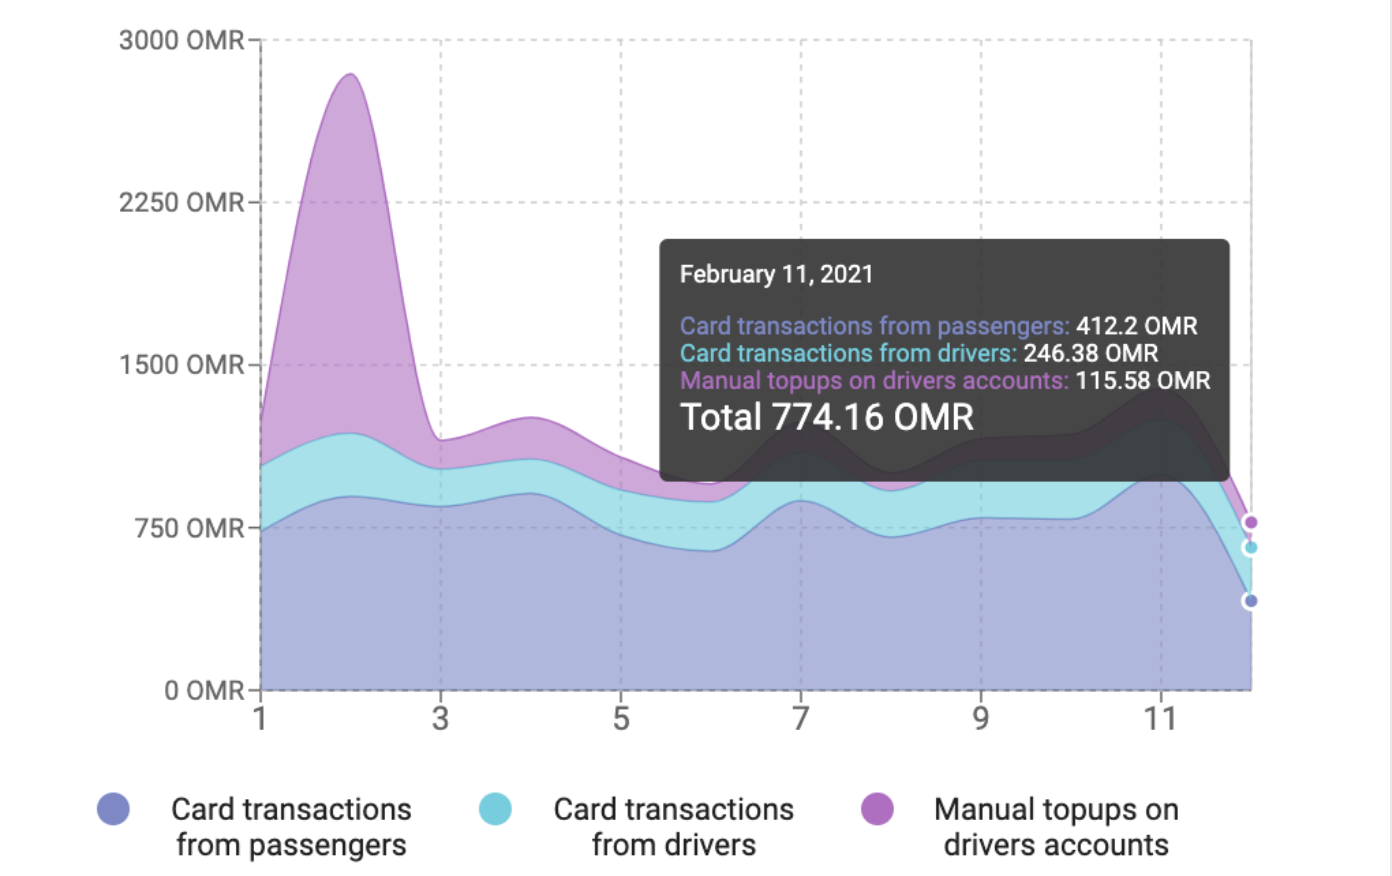
What to look for: Use it to monitor financial performance and growth across your different income streams.
By reviewing these charts regularly, you can:
Monitor your company’s performance.
Identify areas for improvement.
Make data-driven decisions to grow your business.